 MinersMe Cloud
← Blog · Guides & insights · July 23, 2026
Real Time Amperage Mapping Stops Breaker Trips
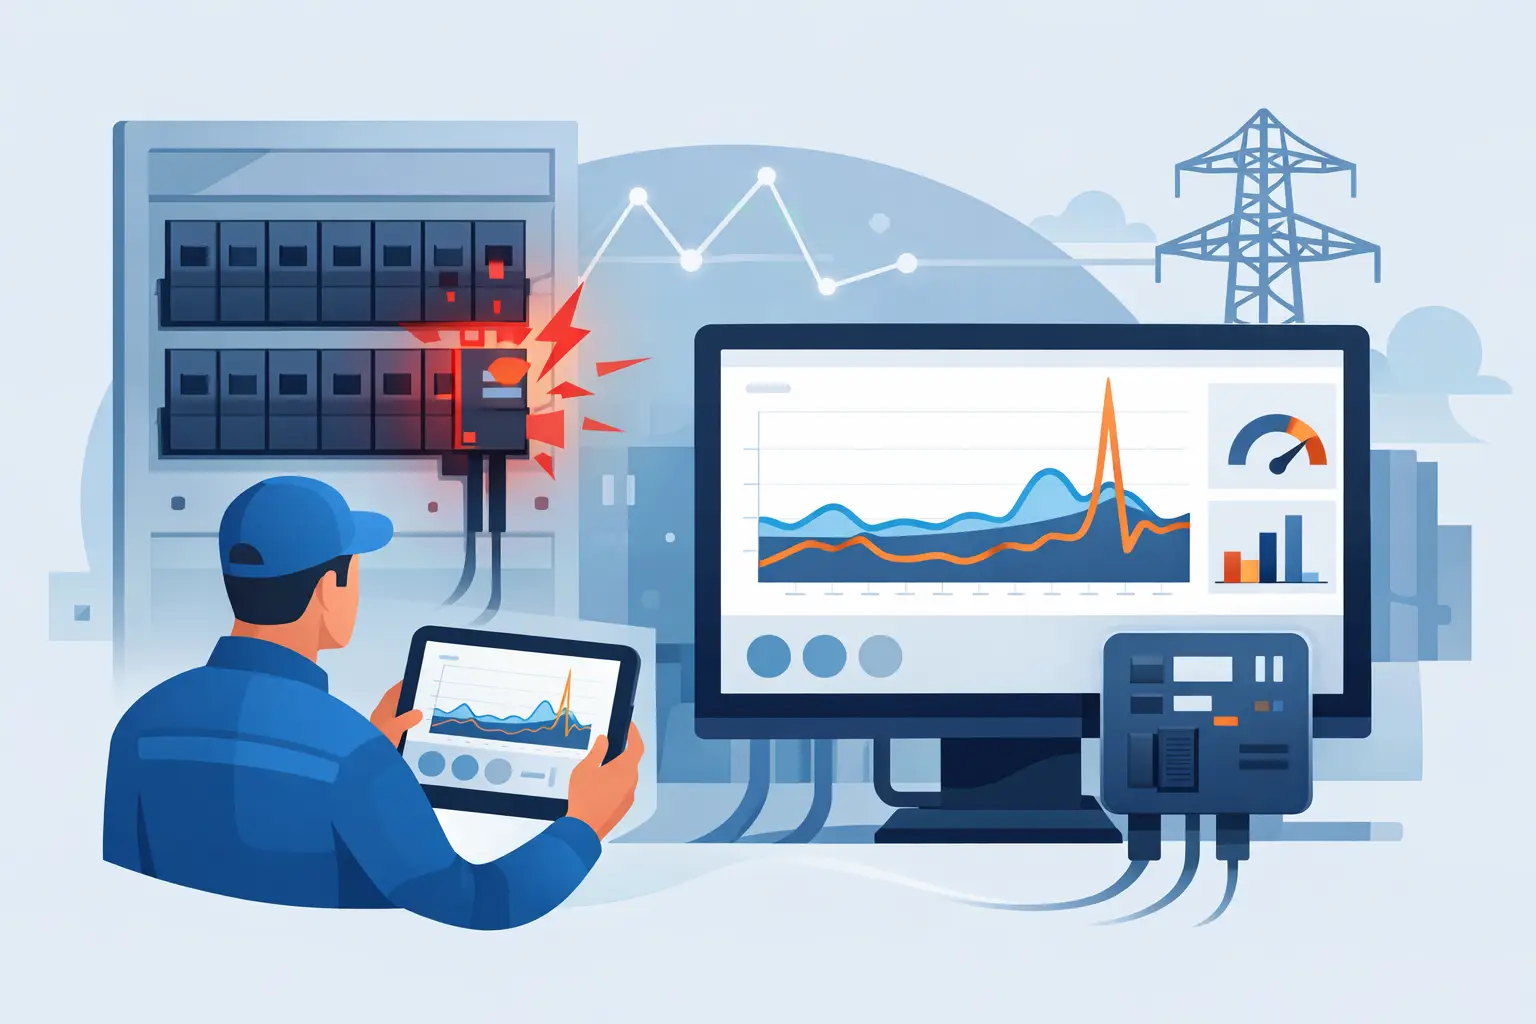
A breaker does not care that the fleet dashboard is green. It cares about the actual current moving through that circuit right now. Real time amperage mapping gives mining operators that answer before a hot leg becomes a trip, a hall outage, and a customer-revenue problem.
For an ASIC farm, electrical visibility cannot stop at a site-level kW number or a monthly utility bill. Those figures are useful for planning, but they do not tell an electrical lead which breaker is carrying the uneven load, which row is creeping toward its limit, or whether a restart event pushed a circuit past a safe operating threshold. By the time someone finds the answer with a clamp meter, the event may already be in motion.
Why breaker-level visibility changes operations
Most large mining outages do not begin as a clean, obvious failure. A circuit gets loaded unevenly after miners are swapped. A technician brings a row back online without accounting for the remaining live load. A hot ambient period increases draw. Firmware settings change performance behavior. One phase carries more than the other two. Then a breaker trips.
The direct loss is visible: machines stop hashing. The secondary damage is where operators lose time and money. Technicians are pulled from scheduled repairs. The hall has to be inspected, restarted, and stabilized. Customers ask why their workers went offline. If the event affects a hosted fleet, the operations team may also be dealing with SLA credits, billing questions, and a support queue that should never have existed.
A static electrical diagram cannot keep up with a live hall. Neither can a spreadsheet built around nameplate ratings. ASICs do not all consume exactly the same power, and fleets change constantly. Boards degrade, fans fail, firmware profiles differ, and machine placement shifts with repair activity. The electrical map has to reflect what is actually happening at the breaker, not what someone believed would happen when the row was commissioned.
What real time amperage mapping should show
Real time amperage mapping is the live relationship between measured current and the physical electrical hierarchy: site, transformer or panel, PDU, breaker, phase, rack or row, and the miners connected below it. The point is not to make a prettier power dashboard. The point is to give the operator a fast path from abnormal current to the equipment and operational decision behind it.
At minimum, an actionable view shows current amperage by breaker and phase, rated capacity, configured safety threshold, load percentage, and the miners assigned to that circuit. It should make imbalance visible rather than burying it in an aggregate total. A circuit at an acceptable total load can still have a dangerous phase condition.
The map also needs context. If current rises, an operator should be able to see whether the increase came from a controlled batch restart, a newly energized rack, a firmware change, or a machine population that is drawing above its expected range. Without the miner-to-breaker relationship, electrical telemetry becomes another alert stream that someone has to investigate manually.
Aggregate kW is not enough
A facility may report comfortable headroom while individual breakers are near their limits. This happens when total capacity masks poor distribution. One row can be overloaded while another has room, especially after repeated repairs and machine moves.
That is why circuit-level current matters more than a broad utilization percentage during live operations. The person making the call needs to know which load can be moved, curtailed, or held offline. They do not need a generic warning that the building is using power.
Current must be tied to physical reality
The best electrical data is useless if the asset map is wrong. If Miner A is recorded on Breaker 12 but has been moved to Breaker 18, the system will lead the team in the wrong direction during an incident. Mapping requires discipline: every installation, swap, and decommission must update the chain of custody between miner and circuit.
For smaller farms, that process can be maintained with disciplined technician workflows. For hosting operations with thousands of units and frequent repairs, it needs to be built into the operational system. Electrical mapping is not a one-time commissioning project. It is a live inventory problem.
Turn electrical telemetry into action
A current reading does not prevent a trip by itself. The value comes from the response it triggers. Operators need thresholds that account for breaker rating, continuous-load policy, environmental conditions, startup behavior, and the site’s own operating margin. There is no universal percentage that works for every facility.
A well-run farm separates warning conditions from urgent intervention. A warning may tell the electrical lead that a breaker has held an elevated load for a defined period. An urgent event may require the system to block additional starts, notify the right team, or identify a controlled set of miners that can be paused before protection hardware acts first.
That response should be specific. "High amperage" is not a work order. "Breaker B-14 is at 87% of configured continuous capacity, Phase C is carrying the excess, and 18 miners were restored in the last 12 minutes" gives the operator something to verify and act on.
The same logic applies after a trip. Do not blindly restore every miner on the circuit. Confirm the cause, inspect the breaker and connections where required, validate the mapped load, then stage the restart. A rushed full-row restart can recreate the failure before the team has left the aisle.
Four operating scenarios where the map pays for itself
Controlled recovery after an outage. After utility work, network recovery, or a planned maintenance window, the temptation is to turn everything on at once. A live amperage map lets the team sequence starts according to actual breaker headroom. That reduces inrush-related surprises and exposes circuits that were already heavily loaded before the outage.
Load balancing after repairs. Repair teams often return machines to the nearest available shelf. Over time, that convenience creates uneven electrical distribution. The map shows where new capacity is needed and where a small number of moves can remove a persistent hotspot.
Separating electrical risk from miner failure. A row of offline machines may look like a network or pool problem from the fleet view. If the breaker current drops at the same moment, the electrical event becomes clear. If current remains present but hashboards go missing, the investigation moves toward machines, cooling, or communications.
Protecting hosted customer revenue. Hosting customers do not care whether their downtime originated in an overloaded circuit, a failed PDU, or a rushed restart. They care whether their miners stayed online and whether the explanation is credible. A precise electrical event record gives operations, support, and billing the same source of truth.
The trade-off: sensitivity versus alert fatigue
Aggressive thresholds can catch risk early, but they can also create noise in a facility with normal load variation. Loose thresholds reduce alerts but leave too little room to react. The correct setting depends on breaker type, circuit design, mining hardware, cooling profile, and how quickly the team can actually respond.
This is why electrical alerts should be tuned from production behavior, not copied from a generic template. Look at normal current by circuit, startup patterns, peak ambient conditions, and the duration of previous excursions. A temporary rise during a controlled restart is different from a sustained, unexplained rise on a stable row.
Operators should also avoid treating electrical data as separate from machine telemetry. A miner drawing abnormal power, showing thermal stress, or producing degraded board performance may be an early clue to a broader issue. The useful question is not only, "Which breaker is hot?" It is, "What changed below this breaker, and what will happen if we leave it alone?"
Build the map into the command system
For fleets that operate at scale, live amperage belongs beside worker status, board health, maintenance tickets, and pool controls. A technician should be able to move from a breaker event to the affected miners, see their recent history, and create a targeted action without switching among disconnected tools.
That is the operating model behind MinersMe Cloud: electrical conditions are not isolated facility data. They are part of the same production record as machine health, remote actions, maintenance workflows, customer impact, and settlement.
Start with the circuits most likely to hurt the business: heavily loaded rows, high-density containers, frequently repaired sections, and hosted customer allocations with tight uptime commitments. Validate the physical mapping, establish realistic thresholds, and test the response process during normal operations. A map nobody trusts during an outage is just another screen.
The useful result is not more telemetry. It is the ability to see a breaker approaching trouble, know exactly what is attached to it, and make a controlled decision while there is still time to make one.
See it on your own fleet: create a free account, install the agent, or open the live demo — full fleet-to-chip monitoring is included in Pro at $0.40/miner.